Yield Strength vs. Tensile Strength - What's the Difference?
When selecting materials for an engineering application, critical mechanical properties of the material must be reviewed. Two such properties are yield strength and tensile strength. They are both measures of a material's resistance to failure, either by deformation or fracture. Despite this similarity, yield strength and tensile strength are two very different parameters.
In short, yield strength is the maximum stress a material can endure beyond which it begins to permanently deform, not able to return to its original dimensions. Whereas, tensile strength is the maximum tensile stress beyond which a material fails and breaks.
One property can be considered more important than the other depending on the type of material. If the material is ductile, yield strength is usually the more prominent property to consider, while tensile strength takes precedence in brittle materials.
In this article, you will learn about:
- What yield strength and tensile strength represent and how they compare
- How proof stress comes into play
- The yield strength and tensile strength values for various materials
What is yield strength?
When subjected to stress, a material undergoes recoverable deformation. The yield strength of a material represents the stress beyond which its deformation is plastic. Any deformation that occurs as a result of stress higher than the yield strength is permanent.
Because of the linearity of elastic deformation, yield strength is also defined as the greatest stress achievable without any deviation from the proportionality of stress and strain. Beyond this point, large deformations can be observed with little or no increase in the applied load. Yield strength is measured in N/m² or pascals.
The yield strength of a material is determined using a tensile test. The results of the test are plotted on a stress-strain curve. The stress at the point where the stress-strain curve deviates from proportionality is the yield strength of the material. Some plastics’ deformation is linearly elastic, and once the maximum strength is reached, the material fractures.
The yield strength of a material can be increased by certain material processes. However, it is difficult to define an exact yield point for certain materials from the stress-strain curve. This is because these materials do not display an abrupt curve; rather the onset of yield occurs over a range. It is, therefore, practical to use proof stress as a representation of the yield strength.
What is proof stress?
Proof stress is the practical limit beyond which a material would permanently deform. With further applied stress, a material can ultimately undergo fracture.
Also known as offset stress, proof stress is simply how much stress a material can withstand until it exhibits a marginal amount of plastic deformation or strain. That amount of strain is arbitrarily chosen as 0.2%. This rule-of-thumb approximation was originally based on the yield strength of steel and can be used for materials of which the yield point is difficult to define, such as aluminium, copper, and magnesium.
On the stress-strain curve, proof stress is measured by drawing a straight line starting at 0.2% of the plastic strain parallel to the initial tangent to the elastic curve. The stress at the point where this line intercepts the curve is the proof stress.
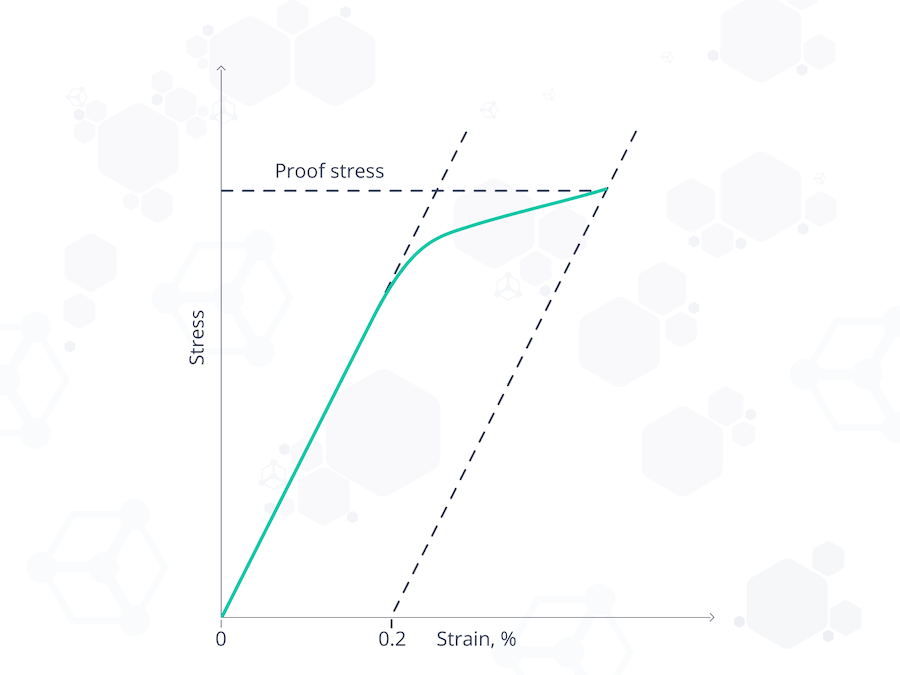
Figure 1. A graph showing how 0.2% proof stress is measured.
What is tensile strength?
Often referred to as ultimate tensile strength (UTS), tensile strength is the maximum tensile load a material can withstand prior to fracture. It is a measure of a material's resistance to failure under tensile loading.
The tensile strength of a material is determined using a tensile test. It is the highest point on the stress-strain curve, which is plotted after the test. Tensile strength can also be determined using this formula:
σf = Pf/Ao
Where Pf is the load at fracture, Ao is the original cross-sectional area, and σf is the tensile strength, measured in N/m² or pascals.
It is important to note that the tensile strength of a material is a specific value under controlled standard test conditions. However, in practical applications, tensile strength varies with temperature. At 100°C, the tensile strength of copper falls from 220 MPa at room temperature to 209 MPa. These variations are compensated for by using a factor of safety, which is usually a fraction of the original tensile strength in design considerations.
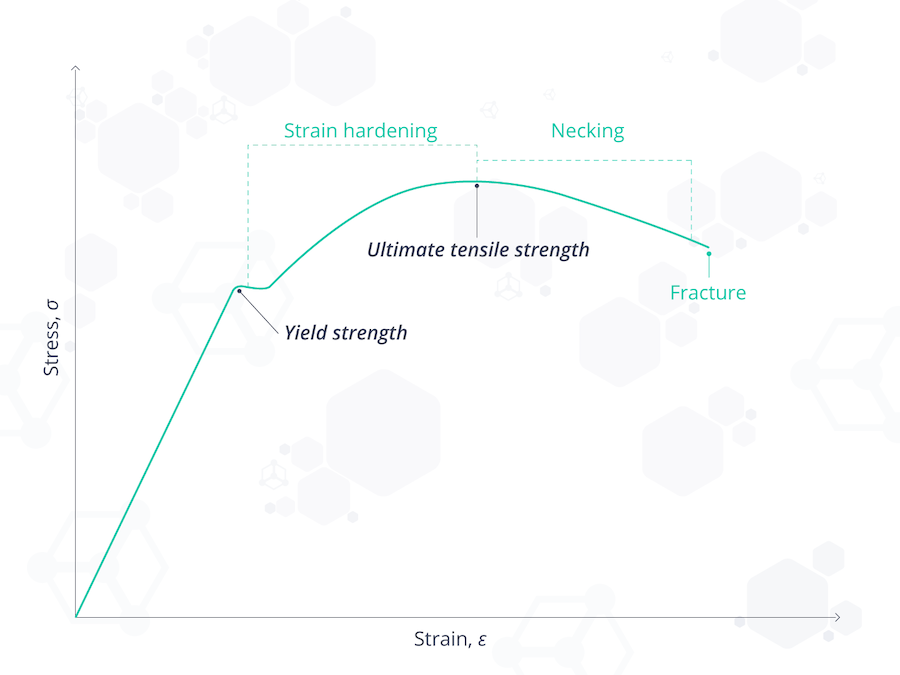
Figure 2. The stress-strain curve showing the yield strength, tensile strength, fracture, and what happens in between.
Comparative analysis of yield strength and tensile strength
The following are some of the major differences between yield strength and tensile strength:
- Yield strength is measured at the point of plastic deformation. Whereas, tensile strength is measured at the point of fracture.
- Tensile strength is rarely used in the design consideration of structures made from ductile materials. This is because these materials undergo substantial deformation before their tensile strength is reached. Rather, yield strength is considered for ductile materials, while tensile strength is used for brittle materials.
- During design considerations, tensile strength is analysed only in uni-axial loading. Multi-axial stress states are estimated in yield strength analysis.
- Deformation of materials occurs after yield strength has been surpassed, while tensile strength is reached after deformation has taken place. In brittle materials, tensile strength is reached with minimal or no yield.
- Tensile strength is usually of a higher numerical value than the yield strength of a particular material.
- The tensile strength of a material can be ascertained with 100% accuracy. However, yield strength has to be estimated for most materials.
Yield strength vs tensile strength values of common engineering materials
Below are examples of the yield and tensile strength values of some engineering materials.
|
Material |
Yield strength (MPa) |
Tensile strength (MPa) |
|
Copper |
70 |
220 |
|
Aluminium |
95 |
110 |
|
Structural steel |
250 |
400 |
|
Cast iron 4.5% |
130 |
200 |
|
Stainless steel |
502 |
860 |
|
Titanium alloy |
750-800 |
900 |
|
High strength alloy steel |
690 |
760 |
|
Chromium-vanadium steel |
620 |
940 |
|
941 |
1500-1800 |
|
|
Kevlar |
3620 |
3757 |
(Table Source: https://www.engineeringtoolbox.com/young-modulus-d_417.html)
If you've enjoyed reading this article, you can also read more related content here:
Sources
-
Pelleg, J. (2012) Mechanical properties of solids. Illustrated edn. Berlin: Springer science and business media
- EngineeringClicks.com - Yield Strength of Plastics
-
Khurmi, R. S. (2008) Strength of materials. Revised edn. New Dehli: S. Chand publishers
-
Rajput, R.K. (2006) Strength of materials. 4th edn. New Dehli: S. Chand publishers
-
Smallman, R. E. and Bishop, R. J. (1999) Modern physical metallurgy and materials engineering. 6th edn. London: Butterworth Hieneman